Thanks for taking the time to give us such a detailed explanation, Nic. I'm on my third or fourth reading - of the first post with all the math. The more recent historical tour is also quite interesting, and may prompt some further research, but for now I'd like to comment on the earlier stuff. So what is the casual reader to take away from this? aside from perhaps a headache :-) My short summary would be this: Yes, technically speaking there is some energy in the strings above 6 kHz... BUT it is already ridiculously low in level simply due to the way strings vibrate, and even very low impedance pickups are going to be further rolling things off by that point, before we start thinking about further roll off by the filter. Using Nic's numbers, an overtone on an open G that is down by -45 dB around 6 kHz, just isn't worth thinking about. -45 dB is a LOT. While I believe that number is probably in the right ballpark, I might quibble or question a couple of things here. - Nic, you said "The pickup rolls off at 6db/octave from its resonant peak." Seems to me the usual value quoted here, for a pickup loaded with pots, cable, etc, is 12 dB/octave, as in a second order low pass filter. Was this just a typo, or can you clarify? - You also state that "The string rolls off at 6db/octave from the fundamental." I haven't seen it expressed in dB, but from my understanding of string behavior this seems low to me, meaning it should roll off faster and not necessarily with a linear slope. Now, we may not be thinking about the same thing here. Perhaps you are saying that if you play the note at the 12th fret, with the same plucking force or something, it will be down 6 dB from the open, and the 24th down 12? That seems unlikely, so I'm thinking we're talking about the relative strength of the partials of any particular note. If we put aside electronics for the moment and consider just the string, my understanding is that for a plucked string, the amplitude of the partials rolls off as 1/(n squared) where n is the partial, i.e. if you pluck a string such that it moves through a range of 1/4" at the 12th fret, then the 2nd partial will have an amplitude 1/4 of that, the 3rd will be 1/9, the 8th will be 1/64th, and the 30th would be 1/900th! On the other hand, for a struck string - as in a piano, and probably applicable to slapping a string against a bunch of frets - the amplitude decreases as just 1/n. Even so, by the time you get to the 30th partial of the 12th fret G (5.88 kHz), in theory it has an amplitude of only 1/30th of the fundamental. That's only the string, and I don't know how to express that decrease in dB. Also, if I understand correctly electric pickups tend to be somewhat more sensitive to frequency than amplitude, and may therefore recover more of the higher partials than would be "expressed" in an acoustic instrument. Anyway, I don't mean to argue, just curious about this stuff. In regard to one of the questions here about whether it matters, I was reminded of a couple of earlier discussions on the subject. In a moment of indiscretion, I went so far as to suggest that for bass purposes only, buying a cabinet that is rated only up to 6 kHz was a perfectly reasonable thing to do (and have done so, with no regrets). Somewhere a bit down in
this discussion Dave is quite certain that stuff as high as 12 kHz is an important aspect of his tone, while in contrast Thomas (poor_nigel)
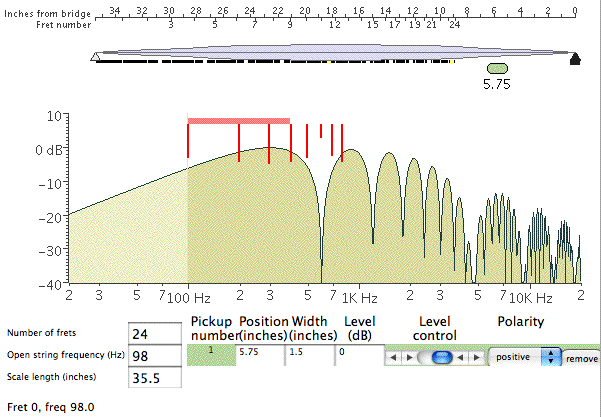
talks about an experiment in building his own cabinets, that resulted in removing the horns he had already purchased because he found nothing useful coming out of them. -------- Moving right along...:-) Tillman's demo applet is indeed quite interesting. I downloaded the code and made some small enhancements for my own purposes a couple years back, and learned some interesting stuff. So I'd like to emphasize a couple of points to help prevent misinterpretation of the graphs. First of all, the chart does *not* show you the response that you are actually getting from the pickup(s). If you don't think about that, and just look at it, you might find yourself saying, Wow, look at all that stuff going on way up at 10 kHz! If you doubt this, try "playing" different notes on the fingerboard at the top, without changing anything else, and you'll see that the plot doesn't change in the slightest. Also note his disclaimer, that it "does not show the effects of the pickup's electrical parameters (inductance, capacitance, loading, etc.)", so it does not reflect the fact that above pickup resonsance - say in the range of 3-6k - the pickup will be rolling off the response quite a bit more. If you're interested, we can look at a few examples. Aside from general curiosity, I spent some time with this program trying to help me figure out whether I might prefer FatBoys to MXYs, or whether I might prefer a different location for the neck pickup. For starters, here's a way to get a more visual or intuitive grasp of this comb filtering business (I haven't needed a comb in so many decades that this is a difficult concept for me...). Here's the plot you get for my bass with a FatBoy in the neck position only (not using the bridge). The numbers are a bit approximate, but my pickups are in the standard position Alembic uses for a 35" scale Rogue; I used a width or aperture of 1.5" for a FatBoy (or Series) and .75" for an AXY/MXY:

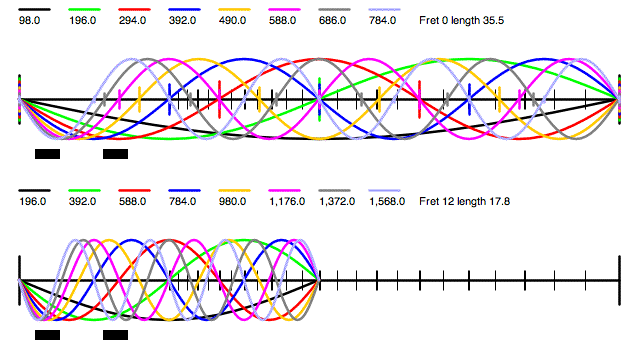
and here's an easy way to see where the notch around 600 Hz comes from:

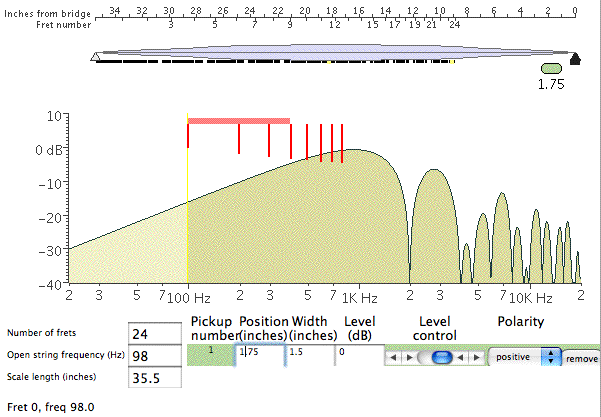
The plot on the top shows the first eight partials of the open G string. Note how the 6th (pink) at 588 Hz has a node or null point nearly centered over the neck pickup. That means the pickup can't really "see" this frequency, hence the first notch around 600 Hz. The bottom plot, fretted at the 12th, shows the same first notch (now red), and a second one (pink) around 1200 Hz, also visible in Tillman's graph. By the way, this is essentially just what the program does. It loops through the range of frequencies, figures out what the shape of the wave is above the pickup, and sums the amplitude at each point over the pickup. So if the wave is either fully above or below the axis then you get a large value, while if it crosses the axis within the pickup width you get some cancellation, equating to zero if the crossing point is dead center. Though I may have missed it (don't think so), he makes no attempt to adjust for decreasing amplitude in higher partials, partly because he isn't working with partials per se, but also based on his statement in a referenced article that magnetic coils are more responsive to higher frequencies than larger amplitudes, "so it all evens out" (not a direct quote, but close). While I think that might be fine as a first approximation, my guess is that it significantly overstates the response above around 1-2 kHz. What I believe you see in these charts assumes that even up at 10 or 20 kHz, the string is vibrating in a way that *could* produce as much output from the pickup as the open fundamental. Though it's useful to look at it this way within the range of notes you can actually play, it becomes unrealistic at the higher frequencies. Back to the charts with all the sine waves, note how much less confused things are down at the bridge pickup, which is evident in the Tillman plot for just a bridge FatBoy - the first notch is all the way up around 2 kHz, because that's the frequency at which you first get a null/node over the bridge pickup:

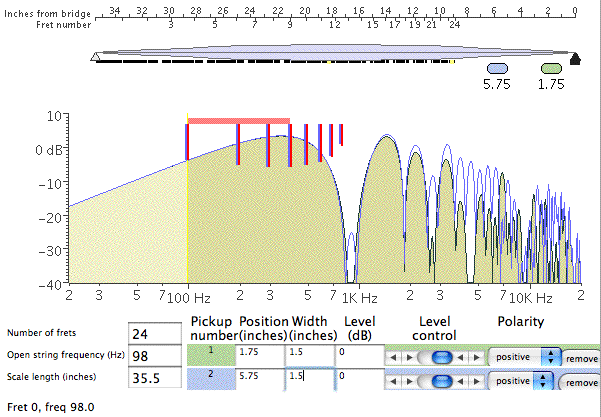
In case you're wondering about those vertical red lines, I added them to show the frequencies of the first eight partials for the selected note. The original horizontal red bar shows the two octave range available for the string (24 frets), while the new vertical bars help to visualize how the early partials of any particular note line up with the response curve. If you were actually looking at a plot of the response for a a particular note, the chart would be mostly empty with sharp peaks where each of these red vertical bars appear, plus more to the right for the higher partials. Disregard the exact height of these lines - I wasn't interested enough to figure out the math, so they all start as a constant height and just get scaled by the response. But you can see in the first plot that the 6th partial is greatly reduced by the bridge notch, perhaps more than appears here, and of course all of them would be decreasing drastically even before considering the pickup response. One last Tillman plot, that was helpful to me. This one uses both pickups. The regular plot (tan-ish area) assumes wide aperture (FatBoys or Series) in both the neck and bridge positions, while the blue outline show the response after replacing the neck FatBoy with a narrow aperture (MXY) centered in the same spot:

Notice how the narrow aperture at the neck helps a lot to fill in the gaps, and is consistent with my preference for this combination. If I ever built another custom, I would probably move the neck pickup closer to the bridge to further even out the response (you can always add more bass with a SuperFilter). ----------- Finally, one more question/comment for Nic. In regard to the 9 dB Q switch gain, you state that "The goal is to recover the raw string information that disappears into the first few notches in the comb filter". Well, maybe, but I'm quite skeptical about both the implied motivation on Ron's part, as well as the effectiveness. The main problem I have with this theory is that the notches are significantly different for each of the pickups, and furthermore for each of the strings (on each pickup). Here are the approximate positions of the first notch, for strings EADG, separately for each pickup, and combined with both pickups (both assumed to be wide aperture in standard positions): neck: 250, 330, 450, 590 bridge: 830, 1100, 1470, 2000 both: 370, 500, 650, 850 With two pickups, even the 8th partial doesn't get up to the second notch until you're playing above the 13th fret or so. For just the bridge pickup, the 8th partial won't fall into a notch for any note you can play, although for neck only the 8th falls into a hole when you play at the 7th fret, and you find the 3rd notch if playing the 14th fret. So where am I going with this? - Let's assume for the moment that the tone you actually end up hearing, is shaped almost entirely by the first 8 or fewer partials. I think this is actually somewhat generous, though no doubt some will disagree, and I'm interested in "hearing" any serious counterpoint. - If that's a valid assumption, then if you are using an even balance of both pickups, the second notch doesn't affect you until you are playing above the 12th fret. - The notch you have to contend with ranges from around 370 to 850 Hz, depending on which of the four strings you happen to be playing. Now, you might *conceivably* try to use Q to fill in such a notch, but would encounter at least the following problems: - you could only do so for a single string - you would have a very difficult time dialing it in that precisely - setting the filter frequency low enough to cover any one of these four points would have already grossly colored your sound, not helped to even it out. Look, I'm not trying to be difficult or obnoxious, but we are talking about physics and lots of numbers here, and I think it's important to review carefully. While the magic of the 9 dB number seems to work out conveniently with some of the math, I don't buy the suggestion that it is there to deal with the notches in the response curves, or more generally to help even out the pickup response - which would imply you should leave it on all the time, at some particular frequency, to get the most even response, except that it won't do so as noted above. My personal guess is that the value was chosen largely because it provides for an interesting variety of *uneven* responses, depending on where the frequency is set. It makes for an interesting tone shaping device, not a solution for the uneven response due to comb filtering. But hey, I've been wrong before, so please feel free to straighten me out. -Bob