Author Topic: Filter cutoff frequency  (Read 1727 times)

sfnic

  • club
  • Member
  • *
  • Posts: 148
Filter cutoff frequency
« Reply #15 on: June 27, 2005, 05:40:16 PM »
Dave -  Tillman's applet is awesome.  See what happens when you keep enlarging the pickup aperature!

David Houck

  • Global Moderator
  • Senior Member
  • ******
  • Posts: 15597
Filter cutoff frequency
« Reply #16 on: June 28, 2005, 06:52:50 AM »
Nic; when I fret the string, by moving the left end of the blue vibrating string, the yellow line that marks the note along the frequency scale moves as well, but the curve does not change.  I must be missing something there.
 
Otherwise, everything else seems to work and is quite interesting.  Changing the aperature produces an unexpected result.  It would appear that the narrower the aperature, the better the high end response.  With two pickups, I find quite interesting how the relationship between the level controls changes the curve.

gare

  • club
  • Advanced Member
  • *
  • Posts: 457
Filter cutoff frequency
« Reply #17 on: June 28, 2005, 07:45:11 AM »
Nic
Just wanted to say thanks for your wonderfully informative dissertations. I made a hard copy of the  one above for future reference.
You're a regular cornucopia of instrument information !
Keep em coming !
 
Gare

richbass939

  • club
  • Senior Member
  • *
  • Posts: 1221
Filter cutoff frequency
« Reply #18 on: June 28, 2005, 11:09:01 AM »
Christopher, before we forget, welcome to the club.  Your question started a great series of posts that are a good example of the wealth of knowledge that exists in this club.
Personally, I like it when a young person is interested in Alembics.  There are quite a few of us who were your age or older when Alembic started up and didn't have the chance to own one until much later.
If you want, start a thread in the Introductions section and tell us about yourself and your musical interests.
Rich

bob

  • club
  • Senior Member
  • *
  • Posts: 808
Filter cutoff frequency
« Reply #19 on: June 28, 2005, 01:59:35 PM »
Thanks for taking the time to give us such a detailed explanation, Nic. I'm on my third or fourth reading - of the first post with all the math. The more recent historical tour is also quite interesting, and may prompt some further research, but for now I'd like to comment on the earlier stuff.  So what is the casual reader to take away from this? aside from perhaps a headache :-)  My short summary would be this: Yes, technically speaking there is some energy in the strings above 6 kHz... BUT it is already ridiculously low in level simply due to the way strings vibrate, and even very low impedance pickups are going to be further rolling things off by that point, before we start thinking about further roll off by the filter.  Using Nic's numbers, an overtone on an open G that is down by -45 dB around 6 kHz, just isn't worth thinking about. -45 dB is a LOT.  While I believe that number is probably in the right ballpark, I might quibble or question a couple of things here.  - Nic, you said "The pickup rolls off at 6db/octave from its resonant peak." Seems to me the usual value quoted here, for a pickup loaded with pots, cable, etc, is 12 dB/octave, as in a second order low pass filter. Was this just a typo, or can you clarify?  - You also state that "The string rolls off at 6db/octave from the fundamental." I haven't seen it expressed in dB, but from my understanding of string behavior this seems low to me, meaning it should roll off faster and not necessarily with a linear slope.  Now, we may not be thinking about the same thing here. Perhaps you are saying that if you play the note at the 12th fret, with the same plucking force or something, it will be down 6 dB from the open, and the 24th down 12?  That seems unlikely, so I'm thinking we're talking about the relative strength of the partials of any particular note. If we put aside electronics for the moment and consider just the string, my understanding is that for a plucked string, the amplitude of the partials rolls off as 1/(n squared) where n is the partial, i.e. if you pluck a string such that it moves through a range of 1/4" at the 12th fret, then the 2nd partial will have an amplitude 1/4 of that, the 3rd will be 1/9, the 8th will be 1/64th, and the 30th would be 1/900th!  On the other hand, for a struck string - as in a piano, and probably applicable to slapping a string against a bunch of frets - the amplitude decreases as just 1/n. Even so, by the time you get to the 30th partial of the 12th fret G (5.88 kHz), in theory it has an amplitude of only 1/30th of the fundamental.  That's only the string, and I don't know how to express that decrease in dB. Also, if I understand correctly electric pickups tend to be somewhat more sensitive to frequency than amplitude, and may therefore recover more of the higher partials than would be "expressed" in an acoustic instrument.  Anyway, I don't mean to argue, just curious about this stuff. In regard to one of the questions here about whether it matters, I was reminded of a couple of earlier discussions on the subject. In a moment of indiscretion, I went so far as to suggest that for bass purposes only, buying a cabinet that is rated only up to 6 kHz was a perfectly reasonable thing to do (and have done so, with no regrets). Somewhere a bit down in this discussion Dave is quite certain that stuff as high as 12 kHz is an important aspect of his tone, while in contrast Thomas (poor_nigel) talks about an experiment in building his own cabinets, that resulted in removing the horns he had already purchased because he found nothing useful coming out of them.  --------  Moving right along...:-) Tillman's demo applet is indeed quite interesting. I downloaded the code and made some small enhancements for my own purposes a couple years back, and learned some interesting stuff. So I'd like to emphasize a couple of points to help prevent misinterpretation of the graphs.  First of all, the chart does *not* show you the response that you are actually getting from the pickup(s). If you don't think about that, and just look at it, you might find yourself saying, Wow, look at all that stuff going on way up at 10 kHz!  If you doubt this, try "playing" different notes on the fingerboard at the top, without changing anything else, and you'll see that the plot doesn't change in the slightest.  Also note his disclaimer, that it "does not show the effects of the pickup's  electrical parameters (inductance, capacitance, loading, etc.)", so it does not reflect the fact that above pickup resonsance - say in the range of 3-6k - the pickup will be rolling off the response quite a bit more.  If you're interested, we can look at a few examples. Aside from general curiosity, I spent some time with this program trying to help me figure out whether I might prefer FatBoys to MXYs, or whether I might prefer a different location for the neck pickup.  For starters, here's a way to get a more visual or intuitive grasp of this comb filtering business (I haven't needed a comb in so many decades that this is a difficult concept for me...). Here's the plot you get for my bass with a FatBoy in the neck position only (not using the bridge). The numbers are a bit approximate, but my pickups are in the standard position Alembic uses for a 35" scale Rogue; I used a width or aperture of 1.5" for a FatBoy (or Series) and .75" for an AXY/MXY:  
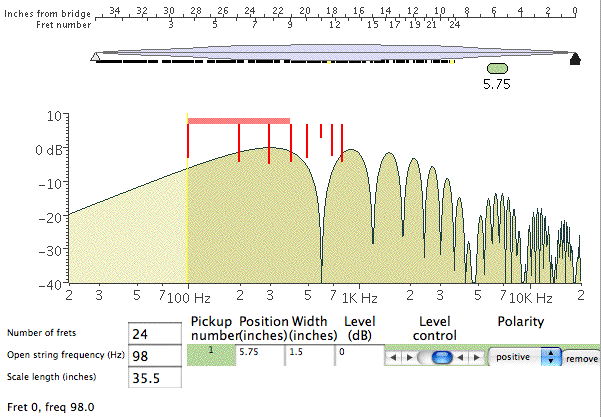
  and here's an easy way to see where the notch around 600 Hz comes from:  
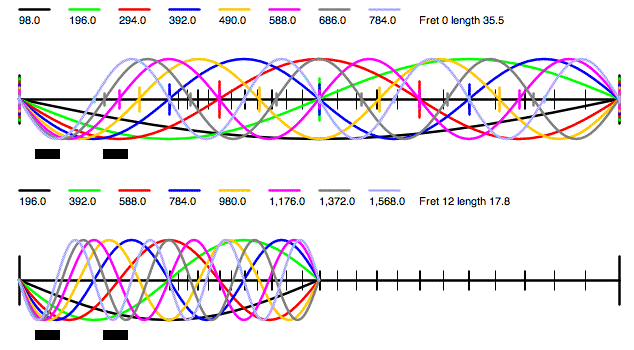
  The plot on the top shows the first eight partials of the open G string. Note how the 6th (pink) at 588 Hz has a node or null point nearly centered over the neck pickup. That means the pickup can't really "see" this frequency, hence the first notch around 600 Hz.  The bottom plot, fretted at the 12th, shows the same first notch (now red), and a second one (pink) around 1200 Hz, also visible in Tillman's graph.  By the way, this is essentially just what the program does. It loops through the range of frequencies, figures out what the shape of the wave is above the pickup, and sums the amplitude at each point over the pickup. So if the wave is either fully above or below the axis then you get a large value, while if it crosses the axis within the pickup width you get some cancellation, equating to zero if the crossing point is dead center.  Though I may have missed it (don't think so), he makes no attempt to adjust for decreasing amplitude in higher partials, partly because he isn't working with partials per se, but also based on his statement in a referenced article that magnetic coils are more responsive to higher frequencies than larger amplitudes, "so it all evens out" (not a direct quote, but close).  While I think that might be fine as a first approximation, my guess is that it significantly overstates the response above around 1-2 kHz. What I believe you see in these charts assumes that even up at 10 or 20 kHz, the string is vibrating in a way that *could* produce as much output from the pickup as the open fundamental. Though it's useful to look at it this way within the range of notes you can actually play, it becomes unrealistic at the higher frequencies.  Back to the charts with all the sine waves, note how much less confused things are down at the bridge pickup, which is evident in the Tillman plot for just a bridge FatBoy - the first notch is all the way up around 2 kHz, because that's the frequency at which you first get a null/node over the bridge pickup:  
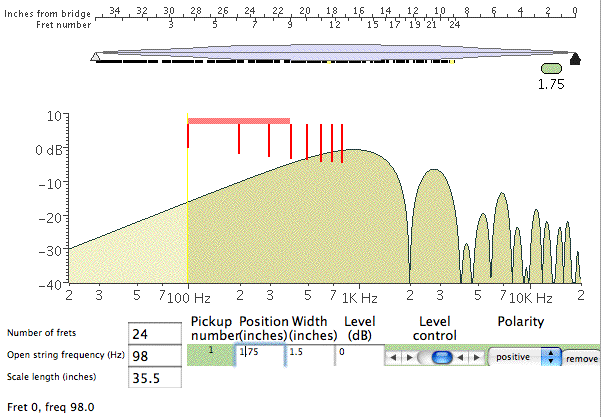
  In case you're wondering about those vertical red lines, I added them to show the frequencies of the first eight partials for the selected note. The original horizontal red bar shows the two octave range available for the string (24 frets), while the new vertical bars help to visualize how the early partials of any particular note line up with the response curve.  If you were actually looking at a plot of the response for a a particular note, the chart would be mostly empty with sharp peaks where each of these red vertical bars appear, plus more to the right for the higher partials.  Disregard the exact height of these lines - I wasn't interested enough to figure out the math, so they all start as a constant height and just get scaled by the response. But you can see in the first plot that the 6th partial is greatly reduced by the bridge notch, perhaps more than appears here, and of course all of them would be decreasing drastically even before considering the pickup response.  One last Tillman plot, that was helpful to me. This one uses both pickups. The regular plot (tan-ish area) assumes wide aperture (FatBoys or Series) in both the neck and bridge positions, while the blue outline show the response after replacing the neck FatBoy with a narrow aperture (MXY) centered in the same spot:  
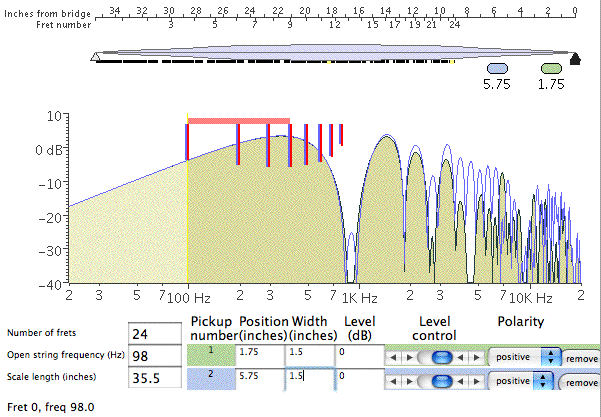
  Notice how the narrow aperture at the neck helps a lot to fill in the gaps, and is consistent with my preference for this combination. If I ever built another custom, I would probably move the neck pickup closer to the bridge to further even out the response (you can always add more bass with a SuperFilter).  -----------  Finally, one more question/comment for Nic. In regard to the 9 dB Q switch gain, you state that "The goal is to recover the raw string information that disappears into the first few notches in the comb filter". Well, maybe, but I'm quite skeptical about both the implied motivation on Ron's part, as well as the effectiveness.  The main problem I have with this theory is that the notches are significantly different for each of the pickups, and furthermore for each of the strings (on each pickup). Here are the approximate positions of the first notch, for strings EADG, separately for each pickup, and combined with both pickups (both assumed to be wide aperture in standard positions):  neck:   250, 330, 450, 590 bridge:   830, 1100, 1470, 2000 both:   370, 500, 650, 850  With two pickups, even the 8th partial doesn't get up to the second notch until you're playing above the 13th fret or so. For just the bridge pickup, the 8th partial won't fall into a notch for any note you can play, although for neck only the 8th falls into a hole when you play at the 7th fret, and you find the 3rd notch if playing the 14th fret.  So where am I going with this?  - Let's assume for the moment that the tone you actually end up hearing, is shaped almost entirely by the first 8 or fewer partials. I think this is actually somewhat generous, though no doubt some will disagree, and I'm interested in "hearing" any serious counterpoint.  - If that's a valid assumption, then if you are using an even balance of both pickups, the second notch doesn't affect you until you are playing above the 12th fret.  - The notch you have to contend with ranges from around 370 to 850 Hz, depending on which of the four strings you happen to be playing.  Now, you might *conceivably* try to use Q to fill in such a notch, but would encounter at least the following problems: - you could only do so for a single string - you would have a very difficult time dialing it in that precisely - setting the filter frequency low enough to cover any one of these four points would have already grossly colored your sound, not helped to even it out.  Look, I'm not trying to be difficult or obnoxious, but we are talking about physics and lots of numbers here, and I think it's important to review carefully. While the magic of the 9 dB number seems to work out conveniently with some of the math, I don't buy the suggestion that it is there to deal with the notches in the response curves, or more generally to help even out the pickup response - which would imply you should leave it on all the time, at some particular frequency, to get the most even response, except that it won't do so as noted above.  My personal guess is that the value was chosen largely because it provides for an interesting variety of *uneven* responses, depending on where the frequency is set. It makes for an interesting tone shaping device, not a solution for the uneven response due to comb filtering.  But hey, I've been wrong before, so please feel free to straighten me out. -Bob

Bradley Young

  • club
  • Senior Member
  • *
  • Posts: 1486
Filter cutoff frequency
« Reply #20 on: June 28, 2005, 04:18:23 PM »
I'm thinking a duel might be the best solution:
 
How about slide rules at 10 paces?
 
I'll second.
 
Brad

jlpicard

  • club
  • Advanced Member
  • *
  • Posts: 416
Filter cutoff frequency
« Reply #21 on: June 28, 2005, 06:38:19 PM »
Definitely a Clash of the Audio Titans. And Dave, absolutely one for the Faq and Must Reads
section! Mike

David Houck

  • Global Moderator
  • Senior Member
  • ******
  • Posts: 15597
Filter cutoff frequency
« Reply #22 on: June 28, 2005, 08:03:48 PM »
Mike; done.

bob

  • club
  • Senior Member
  • *
  • Posts: 808
Filter cutoff frequency
« Reply #23 on: June 28, 2005, 11:28:24 PM »
You know, I'm pretty sure I still have a slide rule here - somewhere, in a box out in the garage, would take me hours to find...
 
It was handed down, perhaps lovingly, by my father - about 14 inches, very fine quality (probably German), and came with a fine leather holster that you could actually mount on your belt.
 
I swear I never did so, but I'm old enough to have been actively using it throughout high school, only switching to a calculator during my first year of college, when there was still some dispute about whether they were legal for use during exams. Based on the demographics of the club, this will probably be vaguely familiar to many of you :-)
 
So what do we do now, at 10 paces? Set them on stun and hurl them at each other? (and Brad, are you any good with these things?)
 
Just a gentle reminder, folks - it's not about Who is right, but What is right. Some of this stuff is really complicated, can be looked at from extremely diverse and sometimes conflicting angles (electronics vs. acoustics, for instance), and much of it is still not well understood, even here in the glorious 21st century.
 
Nic has brought a very welcome scientific/experimental perspective to a number of discussions here, but he's still subject to peer review - and I expect he wouldn't want it any other way. We all have lots to learn, and it's a fascinating area. I look forward to further discussion.
 
PS: I should also formally thank Mr. Tillman for publicizing the source code for his program, because it was much more useful to me after a few simple modifications, and I borrowed some of it, for the math behind the colorful sine waves based on fret position. Thanks.

keith_h

  • club
  • Senior Member
  • *
  • Posts: 3490
Filter cutoff frequency
« Reply #24 on: June 29, 2005, 04:21:04 AM »
Bob,
Yes the great calculator controversy. Went through it in high school. We were encouraged to learn to use them in class but could not use them for tests. However we were allowed to use slide rules on tests (circular or linear). Then I brought my National Semiconductor 100 step programmable to class one day and was told I couldn't use it at all. Didn't matter I had to know the formulas to program it they said it was cheating.
 
The description of your slide rule sounds identical to mine including it being an inheritence from my father.  
 
Keith

fmm

  • club
  • Senior Member
  • *
  • Posts: 549
  • Life is too short to drink bad Scotch
    • Working Class Bass
Filter cutoff frequency
« Reply #25 on: June 29, 2005, 05:26:26 AM »
I've got my Post Versalog 1460 right on my desk.  It scares the hell out of my boss when I use it.  I've got several others in my desk drawer.  Combine that with my HP 41CX calculator (no = key) and my touchpad (no mouse); my boss hates coming to my desk.  She can't make anything work.
 
I also have a 7 foot teaching sliderule in my basement.
fmm

gare

  • club
  • Advanced Member
  • *
  • Posts: 457
Filter cutoff frequency
« Reply #26 on: June 29, 2005, 06:15:31 AM »
Can a slide rule penetrate one of those new kevlar vests?
And that 7 footer should be banned from the games..someone could get hurt if you drop it !
 
This is a great thread !
I know I have a ton to learn on this subject..like Bob just said it's not who but what is correct.
Another related topic that's always interested me was what can human hearing actually hear or perceive ?  Who can actually hear 20hz to 20k hz ?
Ok..that's another thread.
Back to the duel !

richbass939

  • club
  • Senior Member
  • *
  • Posts: 1221
Filter cutoff frequency
« Reply #27 on: June 29, 2005, 04:40:32 PM »
I don't know what my hearing range is but my wife is convinced there is a dead spot somewhere in the middle.  Does anyone know the frequency range of the voice of the average human female, any devices that might enhance my perception in that range, and where I might buy one?  
Rich
 
P.S. Fantastic thread, BTW.

sfnic

  • club
  • Member
  • *
  • Posts: 148
Filter cutoff frequency
« Reply #28 on: June 29, 2005, 06:28:37 PM »
Dave - The applet display seems to work off the open string frequency, regardless of the fret position selected.  It may be browser-dependant; I've only tried it with MSIE.
 
For Bob, some clarifications:  yes, the classic pickup-to-amp-via-cable model says 12db/octave.  That's because you're considering both the capacitive and inductive reactances of the system.  Two reactors, two poles.  I had started my post from the perspective of ignoring the interior loading of the instrument's controls and the cable and the amp's impedence, and forgot to add those losses back in.
 
The reason I didn't consider them initially is because the Alembic filter's output driver is intended to minimize cable effects.  Driving the cable via an opamp output makes the source impedence very low, so the RC and RI reactance poles there are well out of the instrument's  passband.  Since I was playing with the instrument's mechanical performance, I kinda forgot about the downstream factors.  
 
(I also basically ignored the pickup's own C/I poles, figuring that Tillson had included them generically in the applet to generate his response curves, and so adding them again might be redundant.)
 
Overall, I'll stand by the 6db/octave initial slope _from the pickup_ because I'm only really looking at the R impedence pole, and because in the Alembic filter, the pickup loading isn't from the pots, it's from the FET buffer amp.  Yeah, there's 6-8 of shielded cable from the pup to the FET, and there's definitely a measureable effect on the pup's response.  But it's been designed to be as minimal as possible, so for the sake of looking at the following filter, I threw it out altogether.
 
My statement about the string is based on simple free-space wave decay, absent any other environmental factor.  That's equivalent to a single-pole filter because inertia is the only reactive component.  A string deflection at the fundamental equals 1.  The 1st node harmonic's (one octave above fundamental) maximum deflection is .5, or -6db.  
 
Looking again at Bob's note:  1/(n squared) for a plucked string.  Hmmm.  Inverse-square law, based on pre-loading the string with a lateral deflection of 1  Zero energy from the initial displacement; 100% energy applied in restoring the string to a rest state.  
 
You may well be right.  I was working from a simpler 1/n for the struck string (initial lateral deflection of zero; 50% of the energy consumed in placing the string into motion, the balance expended returning to rest), as there's only one pole involved.  I'd need to go back and check.  I'd assumed 1/n, as that sums out to a .707 max deflection at the string's midpoint, when you run the sum-and-differences all the way out.  But 1/(n squared) may indeed be correct, as it deals with ultimately with amplitude of deflection, as opposed to energy expended.


And, of course, that calculation chain refers to the free-space characteristics of a vibrating member supported by two fixed endpoints and affected by no other environmental factors.
And, equally of course, real-world string vibration is a bit different.  On a bass, the string isn't vibrating in free space and the endpoints aren't fixed. Each endpoint is capable of providing secondary impulse drives to the string-in-motion.  What those secondary drives are and how they're applied to the string are major components of the overall tone we hear, as they drive frequency-and-phase-related energy back into the string.
 
In general, however, that re-applied energy is less than the original impulse.  So the string vibration does, in fact, decay.  Should the re-applied energy exceed the string's own vibrational inertia, however, it can force a sustained vibration with deflections potentially greater than 1, up to the modulos of elasticity limitations of the vibrating structure.  At that point, there's either equilibrium (a sustaining oscillator) or traumatic deformation (the Tacoma Verazano-Narrows Bridge, for instance).
 
So, to keep things simple and to isolate the instrument's body effects from the raw string, based on 1/n I took 6db/octave for the string's raw harmonic curve.  The curve won't be steeper than that, free space, and the idea was to see how the primary drivers of pickup position and aperature affected the baseline.  Adding in re-applied energy at the bridge/sustain block and nut/peghead/neck deflection endpoints simply add in additional elliptical filtering.  I suppose that, assuming only two supplemental drivers acting in-phase at any given frequency within the string's harmonic structure, you could see vibrational transients of up to 4 x .707, or 2.828 times greater than the initiating deflection, or about 9db hotter than the fundamental.  But that's only if the endpoint drivers are each _capable_ of driving the string with the 4x the energy of the initial deflection.  I'd assume that, because the source of the re-applied energy is the string itself, even 100% efficiency in reflection would merely keep the string at a 1:1 equilibrium, at best.  And that, only at the fundamental.  The overtones would still decay at an average rate of 6db/octave.
 
Now, add in a third energy re-application source (vibrating air from a loudspeaker, for instance), and things can get a bit out of hand...


Now, in the speaker selection discussion, while I can see both sides, I personally do find that there's useful energy from a bass guitar above 6KHz.  Purely in the pick or finger attack, if nowhere else in the string mechanics.  The attack impulse takes place perpendicularly to the string axis, and has the effect of both striking and plucking the string.  This is more pronounced on a bass than on a guitar, as it's dependent on the duration of contact with the string from the initial impact to the final release.  IIRC, that duration falls somewhere between 1 and .1 millesecond (1 KHz to 10 KHz).
 
There are also abrasion effects as the finger or pick crosses windings.  Again, IIRC, these mini-strikes take place in the range of beween .2 and .02 ms, or 5KHz to 50KHz.
 
Which is a long-winded way of saying that there's a click on the attack that occures somewhere generally above 5KHz.  More so with picks than with fingers; even more so with round-wounds than with flats.
 
I like to get that click out there; hence my preference for JBL 5s and EV T350s.  :-)
 
That said, I often discovered that the mid-range 12s in my rig were essentially MIA (when playing bass through them).  There was _some_ info in there, but I could drop them out and run 15s and 5s with virtually zero change in bass tone.  (But then, I EQ most of my bass' midrange away completely.  There's basically a dead zone from maybe 800Hz up to about 4KHz.  But I _like_ it that way, for some ungodly reason.  
 
On to Ron's motivation for the 9db Q-switch:  I haven't a clue.  It may well have been a case of asking how much gain do we want? and then tweaking it until it sounded right.  That would have been the ultimate criteria, in any case; my reverse-engineering exercise was intended merely to see what there was above 6KHz.  What I found was a notch that happens to generally coincide with the filter's response.  
 
Now, the early filter work, using Ron's initial filters on Dave and Jack's instruments and the giant spaghetti pile Gumby stuffed into Phil's bass, created a set of test beds.  Figuring out what worked best was partially a trial-and-error effort, but it definitely had a starting place grounded in the application of string mechanics.  It's a key reason Jack's bass had variable aperature pups that could be moved.  The designers had a pretty good idea of the range of parameters they wanted to cover, and Jack was a willing guinea pig in determining what sounded good.  Once he nailed it down the settings, Ron measured them, plotted them against what he already had on the mechanical response of the bass, and basically said, this is what's useful; we'll build it like this.  And then went off and designed the production Series filters.
 
Now, my own feeling about the 6KHz notch is that if you're looking for the highest useful sound the instrument will make, you start with the highest fundamental the instrument will produce.  That's a 392Hz G note, 24th fter, G-string.  Even a simple 1/(n squared) analysis of that note shows the G at 6271 Hz is only 1/16 the amplitude (-18db) of the fundamental, without even looking at the comb filter.  Add in a spit into the wind estimate that pickups are rolling off somewhere around there, and take a look at electro-thermal noise generators, and 6KHz starts to look real good for a filter top-end.  Add in a gyrator-sourced resonant peak at the top end, just before you kick the response off the cliff, and you get the pick/finger attack back.  Listen to Jack's solo in Feel So Good off of 30 Seconds Over Winterland, and imagine that tone without a Q-switch boost, or with the filters rolled back.  (Jack was playing flat out on that solo; the bass was giving everything it had, frequency response and output power-wise).
 
I bring that up not to throw it in anyone's faces, but as a sonic example most everybody here will be familiar with.  That specific tone, albeit preferrably not quite so amp-overdriven, is the one of the key tones used as models for the production Alembics.
 
Now, all that said, I _think_ I just agreed with Bob's ultimate point about the Q-switch and the 6KHz notch.  If that's not clear (and it probably isn't ), let me restate:
 
I happened to find a convenient correlation between ONE ASPECT of the complex electro-mechanical model that is an Alembic bass, and ONE ASPECT of the overall filter design applied to that electro-mechanical model.  The ONLY justification I have for assuming any _direct_ correlation is that I used one endpoint datum as definer of the extreme limit condition, and noticed that the filter's designed conveniently covered that endpoint case.
 
That assumption of correlation carries absolutely zero water when considering non-endpoint cases of the e-m model, as Bob is exactly right in pointing out.  Bob suggestion that the value was chosen largely because it provides for an interesting variety of *uneven* responses, depending on where the frequency is set. It makes for an interesting tone shaping device, not a solution for the uneven response due to comb filtering is absolutely correct, when evaluated in light of the actual design process.
 
(And he's also dead-on about peer review!)
 
:-)
 
nic

sfnic

  • club
  • Member
  • *
  • Posts: 148
Filter cutoff frequency
« Reply #29 on: June 29, 2005, 06:30:30 PM »
(And somewhere in his upstairs office, Ron is undoubtedly laughing his ass off at all this noise over what was essentially a techno-artistic design decision that probably took all of 30 seconds to make...)